


While much is still unknown about COVID-19, it’s clear social distancing is widely agreed to be an effective way of slowing the spread, and a containment strategy advised by both the World Health Organization and the CDC. We have seen this work well in China, where the outbreak originated, and also in places like Singapore and South Korea.
It’s why we at Unacast are applying our Real World Graph® data engine to create a pro bono Covid-19 Toolkit to help public health experts, policy makers, academics, community leaders, and businesses in retail and real estate. The first toolkit element, live today, is a new Social Distancing Scoreboard, which we are making available to help raise awareness of and reinforce the importance of social distancing. We also believe it will not only help make sense of what’s happening now, but unearth trends that will help project scenarios in the short- and mid-term future. In the words of this author: “If we don’t take these measures, tens of millions will be infected, many will die, along with anybody else that requires intensive care, because the healthcare system will have collapsed.”
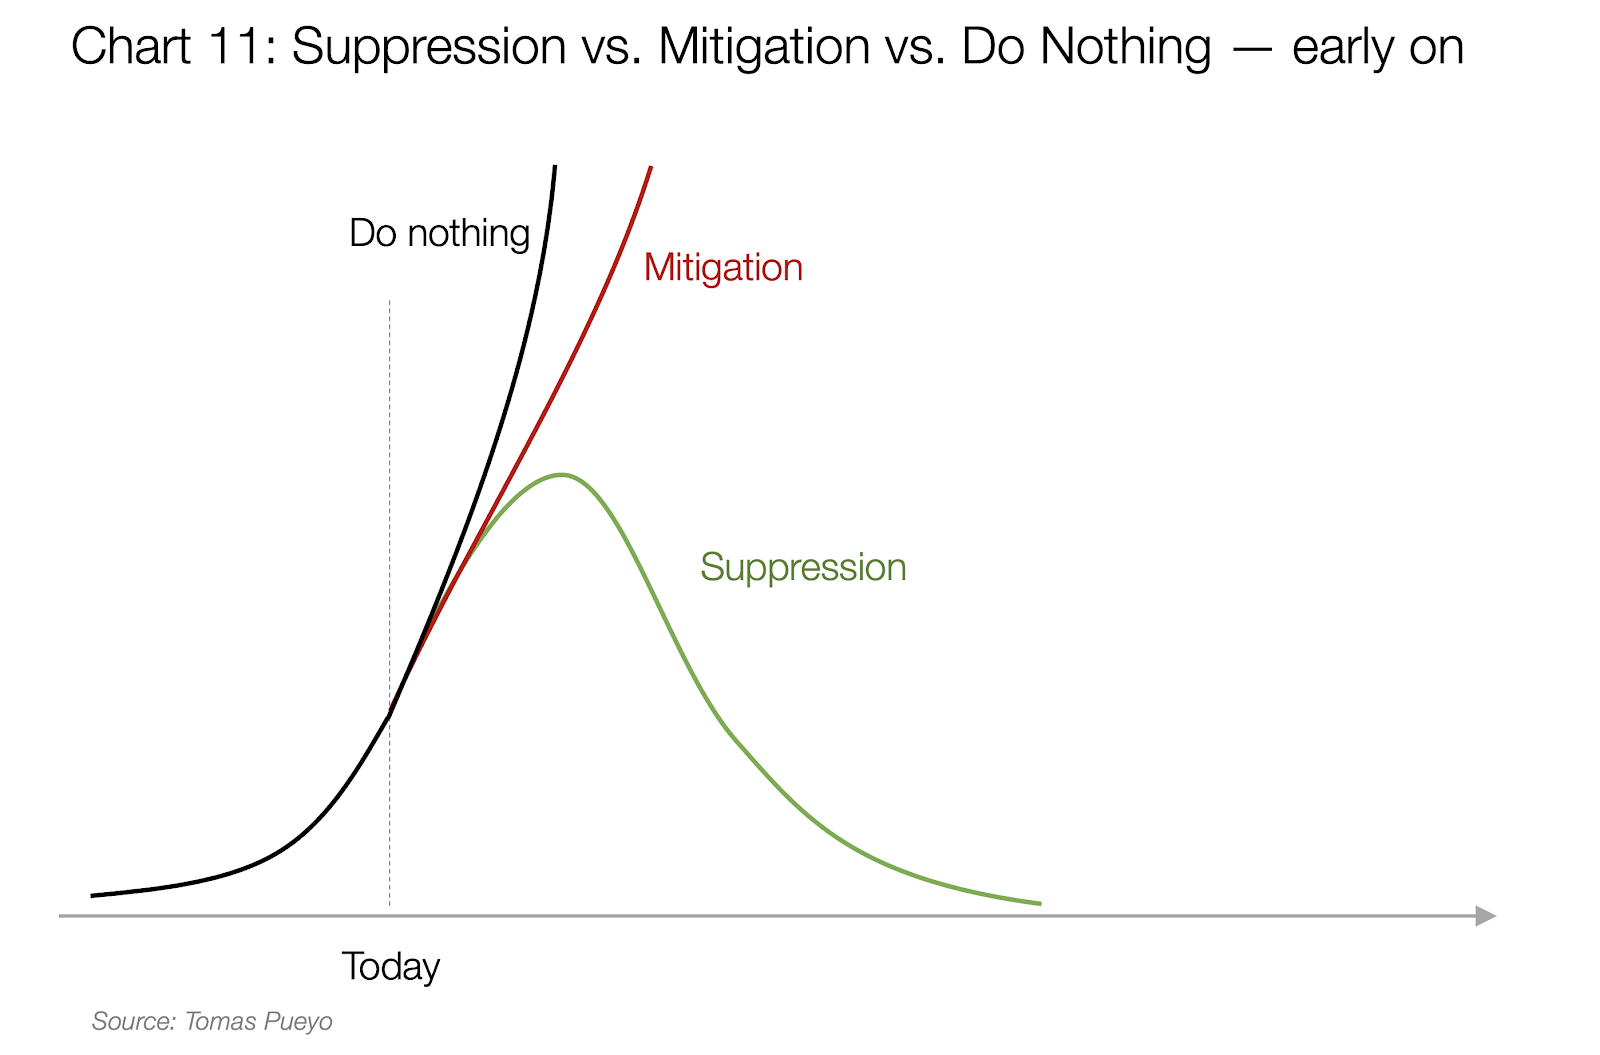
What can we do to help local governments "flatten the curve"?
We realized we could move quickly to apply the Real World Graph® data engine that we’ve developed over the past five years to analyze real-time data in a way that would accurately measure how effective various social distancing strategies perform in the real world. By focusing the geospatial human mobility insights our technology can surface, we created this pro bono Social Distancing Scoreboard as the first of many tools we are developing for a Unacast COVID-19 Toolkit — designed to provide high-quality insights to public agencies, healthcare organizations, local governments and businesses to enable them to learn and act in the best interest of at-risk populations and the general public.
Our Initial Approach
In developing a social distancing score that most valuable to organizations, especially those unfamiliar with human mobility data, we started with a generalized score that takes into account relevant underlying metrics — each of which explains one facet of social distancing behavior.
For our first iteration, we explored:
- People dwelling at home vs dwelling outside their homes (a proxy for how good an area is at "shelter-in-place" behavior)
- Changes in average time spent in and around home, aggregated over time (a proxy for how much time people spend at home versus other venues)
- Change in dispersion of activity clusters, or how many people no longer gathered in the same location at the same time (a proxy for change in number of encounters)
- Change in average distance traveled
Hitting a Moving Target
Speed and accuracy were the two most important requirements for the first iteration; we aimed to provide users with the most useful information possible in the quickest way possible.
Our team quickly realized that there was a second underlying challenge: as the country's behavior changed, so did the underlying data. The models, which we had built and optimized towards a non-COVID-19 world, now need revisiting. For example, our previous model for detecting place of residents was geared towards high confidence that an assigned home is actually a device's home. However, with many people moving to be in another area (e.g. parents' houses, getaway cabins, etc.), the original home assignment model might no longer work well.
Additionally, due to the collection methods of app partners, our methodology for normalizing fluctuating supply levels also needs adjustment.
Identifying the Strongest Signals
After testing each metric, we found the change in average distance traveled worked best as a starting point:
- The metric correlates well with the number of confirmed cases: the more cases are confirmed, the greater the decrease in the average distance traveled on the county level.
- It requires no strong assumptions like an assumed home location.
- It works independently of supply side fluctuations — we get the most signals when people are moving so the metric is unaffected by changes in the ping frequency due to inactivity when people dwell at home.
The metric (while admittedly simple) captures how people adapt their everyday behavior in a few significant areas:
- Switching to home office strongly reduces the daily travel distance.
- Avoiding non-essential trips to entertainment places or spare-time facilities strongly reduces the travel distance.
- Canceling travels and vacations will strongly reduce travel distance.
Continuous Improvement & Refinement
Travel distance is one aspect, but of course people can travel far without meeting a soul or travel 50 feet and end up in a crowd — so we know that the real world picture can be quite complex. As noted above, changing behavior will trigger adjustments in our data strategy. That's why, post launch, we will be continuously working to improve our social distancing models.
For example, as of this writing we are in the process of understanding the best way to add layers that capture more of the complexity of social distancing: exploring how a change in the number of encounters for a given area, as well as a change in the number of locations visited, contribute to an area's social distancing score. Since many important social distancing metrics can be derived from an accurate understanding of residences, we are also dedicating resources to adjusting our home assignment algorithms so that they can better identify new common evening locations.
As we better understand our data and how it describes the new world under COVID-19, we will continuously update our social distancing score as well as develop other datasets that can be used in the fight against COVID-19.
A Note About Privacy
The Social Distancing Scoreboard and other tools being developed for the Covid-19 Toolkit do not identify any individual person, device, or household. However to calculate the actual underlying social indexing score we combine tens of millions of mobile phones and their interactions with each other each day - and then extrapolate the results to the population level. As a company that originated in Norway we put privacy front and center and believe it to be an individual right, and since we operate on both sides of the Atlantic, we have been operating within the GDPR guidelines since May 2018 and this year also adopted the CCPA guidelines for the whole of the US (not only California).


