


Economists use many predictive models to forecast a pending recession, and one of them is dollars spent on men's underwear. The spending index is apparently stable enough to predict when consumers lack the funds to replace their netherwear. Our research on foot traffic correlation with quarterly revenue highlighted how we can use traffic as a predictive mechanism.
What does foot traffic data tell us about men's underwear consumption?
We examined two major underwear brands: Calvin Klein and Tommy Hilfiger. Daily foot traffic between 2019 and 2022 appears in the Tableau workbook below. If you're on your phone, tilt your screen sideways for a better view:
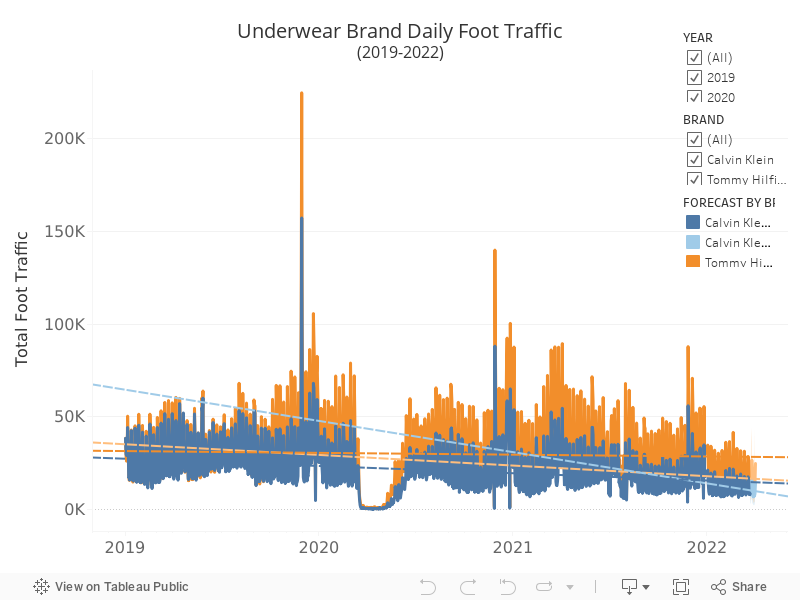
If we examine foot traffic since January 2019, Tableau's forecasting indicates Tommy's stable but Calvin's on the decline. Viewing only 2022 data so far shows these underwear brands are expected to increase foot traffic going into spring. If we add the full year of 2021 data, the picture depicts a downward trend, but not a severe one.

So, 2022 foot traffic indicates there's no recession in the immediate works, but traffic is definitely on a slight downward trend.
We fully acknowledge this foot traffic data isn't exclusively for underwear, or even more specifically men's underwear, but we want to highlight the utility of foot traffic for assessing economic strength. The purpose of the men's underwear index is to track when spending on less necessary items starts to dip--and our research indicates foot traffic is an excellent proxy for this kind of forecasting. Check out our piece on AMC Entertainment Q1 2022 revenue predictions, as well as our forecasting of Amazon's recent brick-and-mortar store closures to learn more.
Want a data sample or a demo? Schedule a meeting to learn more.


