Introduction
Understanding population migration is of paramount importance when making informed decisions about property investments and development. Accurate and reliable data sources play a crucial role in providing insights into migration trends. In the United States, three primary datasets — United States Postal Service (USPS) data, Census data, and GPS data — offer valuable information on population movement. In this article, we will explore the significance of these datasets specifically for location data buyers in the real estate development sector.
As you’ll see in this study, Unacast’s methodology of combining USPS data and GPS data into a machine learning model has shown to be the industry’s most reliable way of looking at population trends in the U.S. This can be clearly seen when you look at the Census migration estimates in New York county in the period of July 1, 2019 to June 30, 2020. While Census estimates similar net out-migration from New York County as in the year before, our models show a higher number of address changes — indicating an unprecedentedly high outflow wave likely caused by the Covid pandemic.
Migration Datasets and Methodologies
Before comparing the three datasets, it is important to first understand the underlying datasets and their methodologies.
Census Data
The Census plays a vital role in tracking migration patterns as part of its annual population estimates, which are based on the Decennial Census conducted every 10 years. By utilizing multiple sources of data, Census provides valuable migration statistics at the county and state levels. However this data encompasses a sample rate of only about 2%.
Census uses different methodologies to estimate migration for different age groups (<18 years, 18-65 years, and 65+ years):
1. Internal Revenue Service (IRS) tax return data for ages <18, and 18-64.
- The migration inferred from IRS requires tax returns from two consecutive years and a matching record from NUMIDENT to assign age to each person.
- Once tax returns are matched, addresses between the two years of IRS data are compared to identify the number of exemptions that moved from one county to another between tax filings.
- Since not everybody files taxes, the direct counts of address changes can’t be used. Instead, IRS data is used to estimate the relative migration rates which are extrapolated to the population in a given age group based on yearly Census population estimates (ACS surveys).
2. Medicare enrollment data from Centers of Medicare and Medicaid Services (CMS) for ages 65+.
- Because the population aged 65 and over is more likely to enroll in Medicare than file taxes, migration flows for people 65+ are inferred from Medicare enrollment data using analogical approach.
3. Social Security Administration’s Numerical Identification File (NUMIDENT) for all ages
Eventually, estimates for all age groups are combined and treated with further transformations to ensure that domestic net migration adds up to 0 and that the number of people in age buckets is in line with the yearly Census population estimates.
USPS Data
The USPS maintains a database of addresses that is updated through several different methods.
- When a customer submits a change of address form, either in person or online, the USPS updates its database with the new address information.
- When mail is forwarded from the old address to the new address, the USPS keeps a record of the forwarding request in its database. This information includes the name of the person who filed the request, the old address, the new address, and the start and end dates of the forwarding request.
This information is further aggregated on the ZIP level, which allows quantification of inflows, outflows and netflows on this spatial granularity.
GPS Data
GPS data collected from mobile apps is aggregated and used for estimation of an approximate home location for each device in the database. The common and well-performing heuristic of monitoring device location during the night hours (i.e., 10pm - 4am) is used for home location assignment. These assignments are regularly re-evaluated so that the home location is updated when it changes. A (semi-)permanent move is registered after a necessary observation period, eg. observing a device in a new location for a period of 8-10 weeks. This time is used to collect evidence that the device consistently and for a reasonably long period spends nights in the new location.
Differences in methodologies, advantages and disadvantages
Census
- Sound statistical forecast that is corrected every 10 years
- Based on difference in address records in two consecutive years
Benefits
- Easy to work with (domestic net flows sum up to 0)
- Apart from domestic migration, Census provides estimates of international migration, deaths and births
Disadvantages
- MP estimates provided once a year
- Data is only at the county and state level
- Flow rates are approximate (based on sample of people who file taxes, are enrolled to medicare, and register change of address with authorities)
- Total volumes depend on correct population estimates that are recalculated every 10 years, aggregated July 1 to June 30
- Migration numbers are directly dependent on population estimates
- Yearly population estimates are based on ACS survey that is sent to approximately 1 in 40 households (sample rate of ~2%)
Potential error:
- Not perfect population estimates (Decennial 2020 revealed an error of 2M people compared to latest yearly estimates)
- Bias in favor of people who file taxes and/or are enrolled in medicare
USPS
- Large sample of people as evidence (+30M people changing address per year)
- Depends on people to register address change when they relocate
Benefits
- Close to 100% sample of the US population (no extrapolation)

- Higher incentive to self-register a move (ensures reception of mail)
- Monthly cadence
- High granularity (ZIP level)
Disadvantages
- Blind to international migration (skewed towards losing population ~1M/year/US)
Potential error:
- Not capturing international migration correctly
- Bias in favor of people who have a permanent address and who are likely to voluntarily report address change
GPS
- Sample size dependent on supply (~5-15%)
- Extrapolation / supply correction is a hard problem to get right
- Depends on definitions of home location and what a move is
Benefits
- Near real-time observation of people’s behavior
- We see the origin and destination very clearly
- We can influence how the move/home is defined
- Not dependent on self-reporting
Disadvantages
- No knowledge about owners of devices that we observe
- Lower sample size
Potential error:
- Bias in favor of people using certain apps (that share location with suppliers)
- Not a perfect estimate in sample size; hard to extrapolate to population correctly
Migration Data Terminology
Net flow
“Net flow” refers to the difference between the number of people moving into a geographic area (in-migration) and the number of people moving out of that area (out-migration). It is calculated by subtracting the number of out-migrants from the number of in-migrants.
For example, if 1,000 people moved into a city in a given year and 800 people moved out of the same city during the same period, the net flow would be +200, indicating a positive migration trend.
Aggregation Period
Various datasets provide data on various cadences. To compare migration numbers of two datasets, it is important to make sure that the temporal window that is used for comparison is exactly the same. Census, for instance, aggregates data from July 1st to June 30th of the next year. Census 2020 population trends, then, are based on numbers on migration between July 1st 2019 and June 30th 2020. In the figure below we illustrate how a slight shift in the aggregation period can influence the final netflow sum by tens of thousands of people for a state like Florida.

Comparison of Unacast and Census-based migration data
Quantitative comparison
Metrics
When evaluating migration patterns, various measures can be used to compare two sources. One metric that is commonly used to assess similarity between two migration data sources is the Pearson correlation of netflows, which quantifies how similarly areas that are growing/declining due to a net migration in one source also grow/decline in the other. The correlation between Unacast and Census are very high in tested Census aggregation years (July 1st-June 30th of 2020, 2021) across all spatial granularities; inspect the plots below.
Another factor to consider is the accuracy of directions, which indicates the percentage of areas that are similarly classified as growing or declining in terms of population due to domestic migration. In 2020, the direction of counties was pointing in the same direction in Unacast and Census in 67%. In 2021, the direction accuracy was 65%.
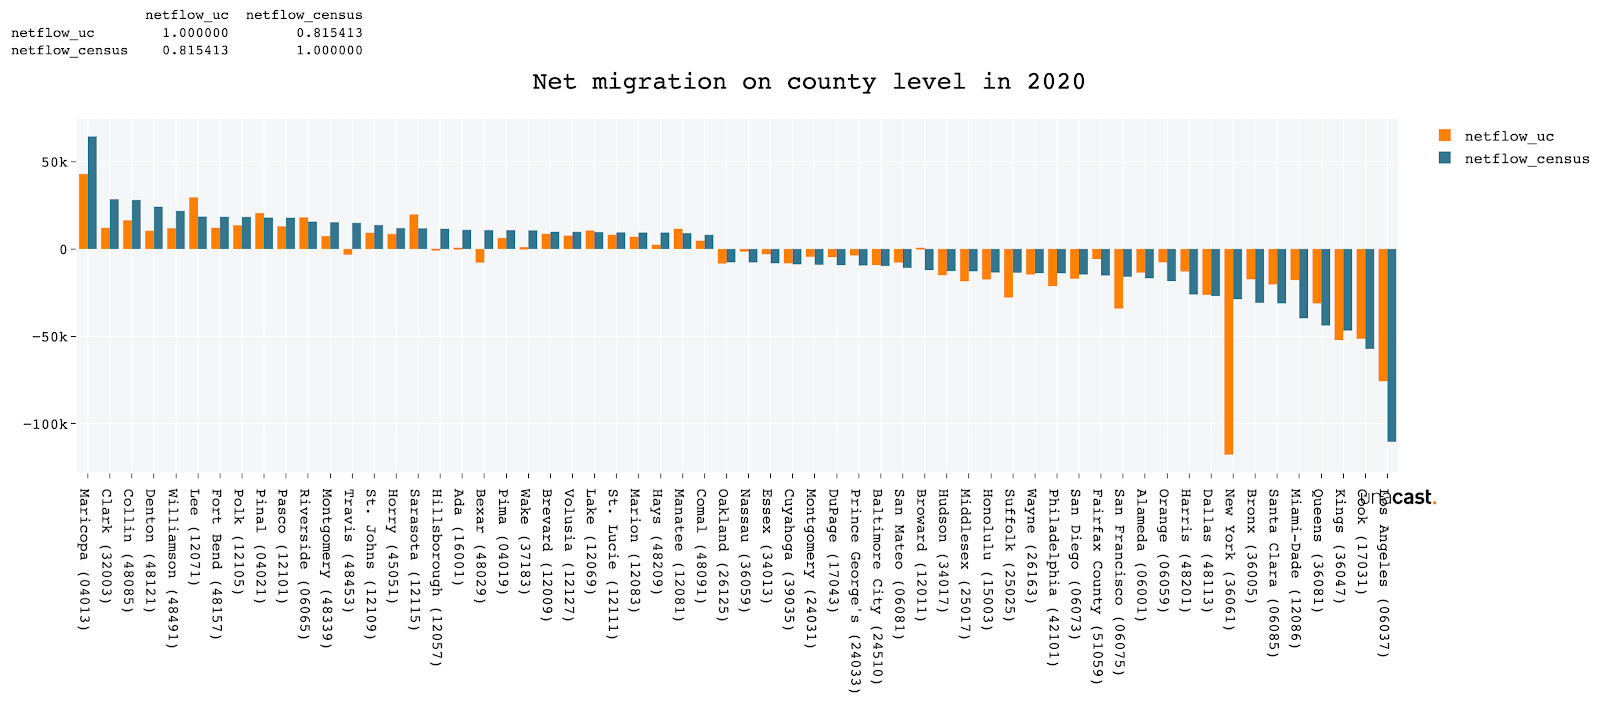
Yearly netflow for 60 counties with highest population change in 2020 and 2021
Pearson correlation: 0.815

Pearson correlation: 0.966
Yearly netflow for 60 MSAs with highest population change in 2020 and 2021

Pearson correlation: 0.928

Pearson correlation: 0.984
Yearly netflow for US states in 2020 and 2021

Pearson correlation: 0.845

Pearson correlation: 0.951

Qualitative comparison
Another perspective on the evaluation of migration trends is a qualitative inspection.
Case study: Wyoming
In the figure below we can see that in 2019 all datasets indicated either net out migration or very minimal in-migration. In the years after, however, Census predicted positive in-migration, while the address change records (USPS data) and home changes based on GPS indicate the contrary. Arguably, this is could be caused by Census not being able to factor in the impact of Covid.

Wyoming
Case study: New York County (Manhattan)
One of the most apparent differences between the Unacast net flows based on USPS data and the Census migration estimates is the case of New York county migration in the period of July 1, 2019 to June 30, 2020. While Census estimates similar net out-migration from New York County as in the year before, the USPS data records much higher number of address changes indicating an unprecedentedly high outflow wave. Arguably, caused by the Covid pandemic.


Case study: Clay County, SD
Based on the Census ACS estimates, Clay County in South Dakota is predicted to grow in population.

However, in our data, the net flow is close to zero before the Covid outbreak, followed by a significant outflow of people from the area during April, May, June and July 2020.

GPS data from this period supports the outflow numbers of the USPS-based trends.

This might be related to the fact that Vermillion, the Clay County’s capital, is home to University of South Dakota with 9,464 students (in 2021) who were likely to relocate to their homes after the closure of schools announced on March 17, 2020.

Demographic profile of Clay County indicates a large proportion of young people (likely students).
Case study: San Bernardino County, CA
Similarly to Census, Unacast data shows that the population in San Bernardino didn’t change much in the yearly aggregate of 2020. However, Census’ estimate that this county lost 1 person conceals a much richer picture of migration in this location. Monthly view based on our data shows the effect of the Covid onset in April and May of 2020.

Summary
Given that Census data is, to a large degree, dependent on the projections of population trends, it is less likely to observe some unexpected trends that direct observation methodologies (such as USPS or GPS based migration) facilitate. In the comparison above, we show that Unacast, which is based on the USPS and GPS data, in general correlates very well with the Census data. Nevertheless, on several examples we also illustrate cases when Covid clearly impacted migration in an area, which both USPS and GPS data were able to pick up, yet Census did not (probably due to the delay).
We would like to emphasize that we’re aware of the strengths of the Census approach, especially when it comes to treating different age groups differently, predicting trends into the future, and making sure that the dataset is statistically sound as a whole.
We would also like to say that we deliberately chose to base our Migration Patterns on USPS data in combination with historical GPS data for a reason. The main motivation is that we believe that near-real time understanding of (changes in) trends and building on top of a dataset with close-to-perfect coverage of the U.S. population (USPS collects about relocation of 30+M people a year) brings the most value to businesses making decisions based on migration insights.
In summary, for tracking changes in real time, USPS data combined with GPS data is much stronger than Census datasets. One shouldn't overestimate the precision of Census data, as there is great uncertainty in Census estimates: Census migration is not based on census surveys, it is based on tax and medicare data. And even these datasets are only used to establish some migration coefficients which are then applied to population estimates that are based on 2% sample of population. Census is based on ideal-scenario estimates that tend to be very long term, and there is post-processing to make it look nice statistically.
With that said, Unacast is the most accurate solution for understanding migration in the United States. To learn more, book a meeting with us today.